|
Air Sea Interaction around Southern Africa |
|
|
|
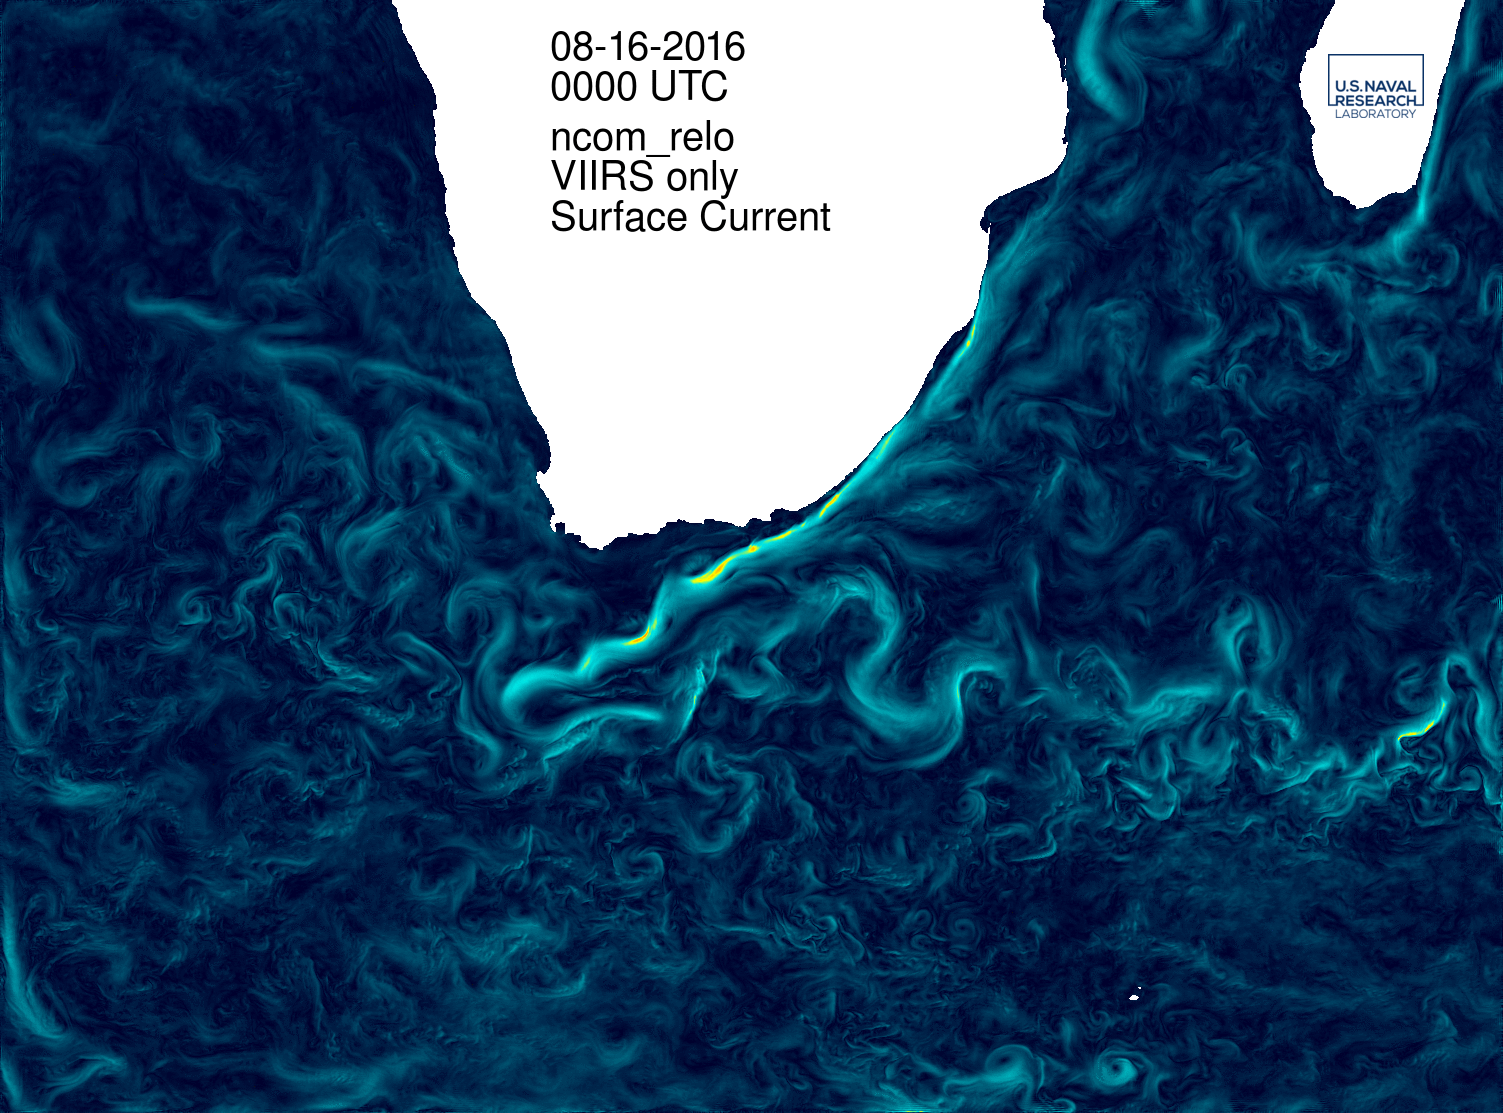
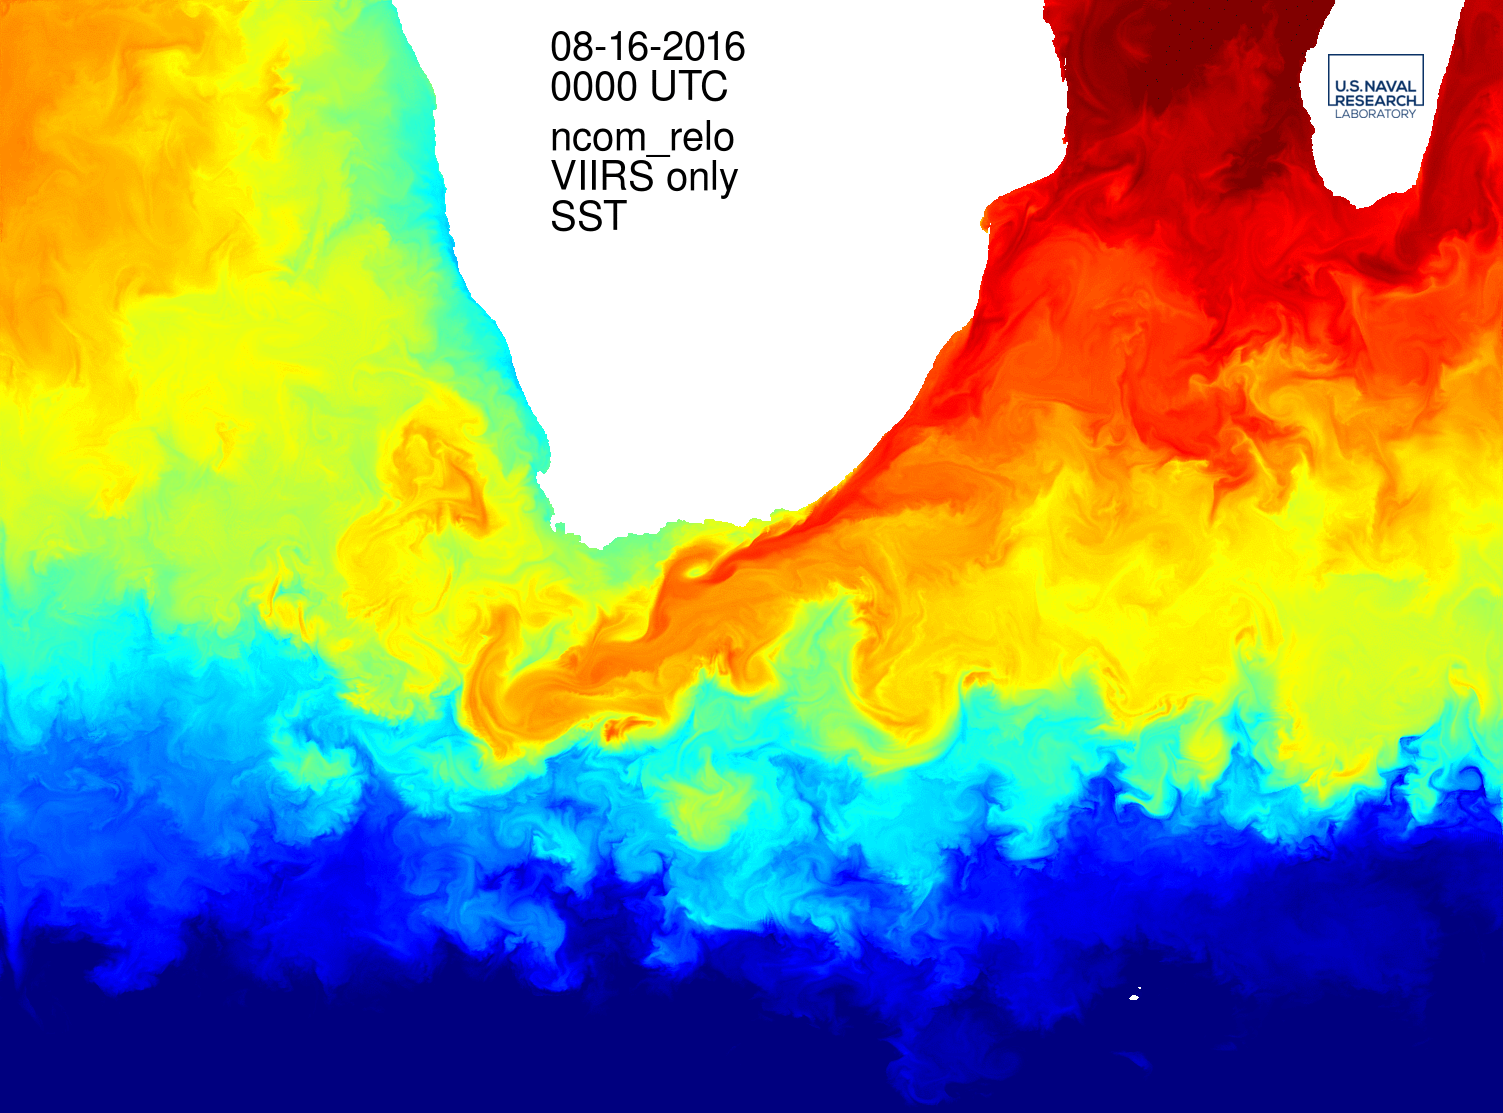
The oceans
around Southern Africa clearly reveal the impact of air-sea interactions via
heat and momentum flux. The ocean response to these interactions is illustrated
by the animations of sea surface temperature (SST) and surface currents
included below. The time series of these surface fields are extracted at a three-hour
frequency from regional Navy Coastal Ocean Model (NCOM) simulations over the
region. This implementation of NCOM on a 3 km grid is forced by Navy Global
Environmental Model (NAVGEM) atmospheric fields.
 Click here for animation of surface currents Click here for animation of surface currents
 Click here for animation of sea surface temperature Click here for animation of sea surface temperature
|  Click here for animation of surface currents
 Click here for animation of sea surface temperature